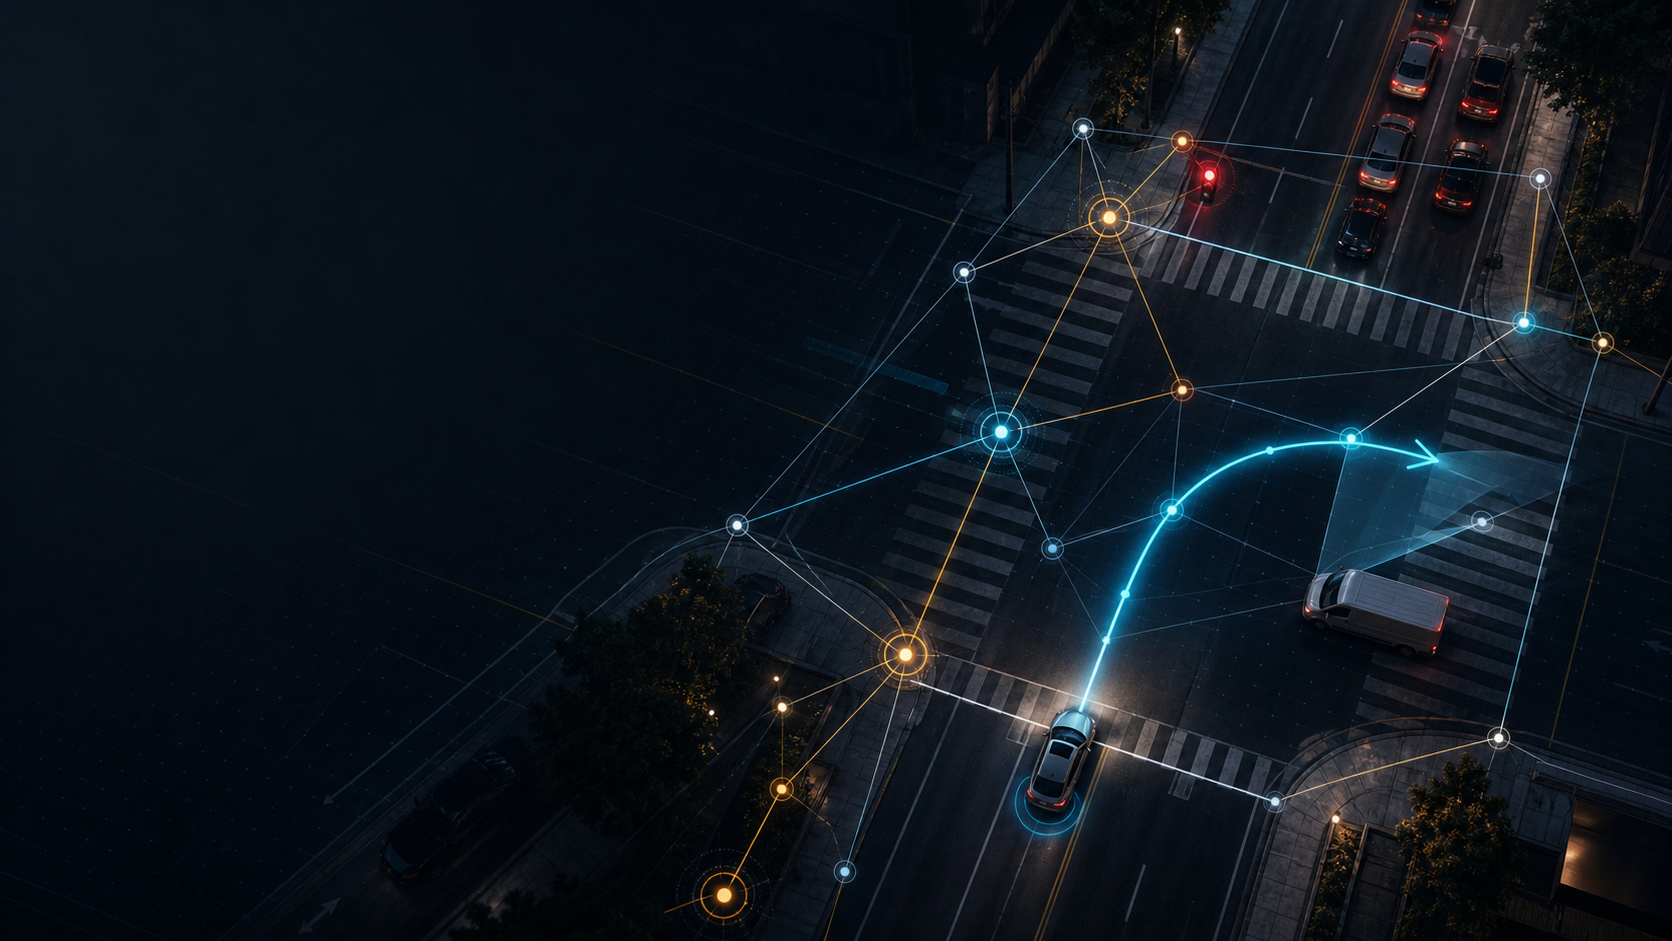
Knowledge Defined Vehicles: Turning Map Geometry into Queryable Driving Context
A public-data-backed concept demonstrator for turning lanes, actors, crosswalks, topology, and temporal observations into a location knowledge graph.
On this page
A few weeks ago, I watched an industry presentation about moving from maps to location knowledge.
That line sounds simple until you sit with it. It frames maps as more than delivered geometry: a dynamic, semantic, connected intelligence layer that is useful to the vehicle at the exact moment a decision has to be made.
That is the part that kept replaying in my head afterwards.
For years, digital maps have been treated as road geometry plus attributes. A lane boundary is a polyline. A crosswalk is a polygon. A traffic signal is a point feature. A speed limit is an attribute. A road segment has an identifier, a heading, and a topological connection to another segment.
That model is useful. It lets a vehicle localize, route, and reason beyond the sensor horizon.
But it is still too thin for vehicle AI.
A vehicle does not only need to know that a crosswalk exists at coordinates x and y. It needs to know whether the planned path intersects that crosswalk, whether a nearby actor is moving toward it, whether an occluding object hides the entry point, whether a traffic rule applies, whether the downstream lane can receive the ego vehicle, and whether the map facts are fresh enough to trust.
That is not just map data. That is location knowledge.
This interactive POC is my attempt to make that idea visible.
The Idea Behind Knowledge Defined Vehicles
I am deliberately not framing this as Software Defined Vehicles.
Software is necessary. Perception models, prediction models, planners, middleware, vehicle services, update systems, and safety monitors all need software. But software alone does not define what a vehicle understands about the situation around it.
A Knowledge Defined Vehicle is defined by the structured, queryable, explainable knowledge it can use about location, actors, rules, constraints, confidence, provenance, validity, and change over time.
The difference is practical. A perception stack may answer what is visible. A lane-level map may answer where road elements are. A Knowledge Graph can connect those facts and answer why the current context matters.
The question becomes less about whether the vehicle has a map and more about what the vehicle can ask the map.
Can it ask which lane segments are successors of the current lane? Can it ask whether the selected path intersects a crosswalk? Can it ask whether a signal state controls this maneuver or another lane? Can it ask whether a downstream queue leaves enough storage for a 4.8 m vehicle? Can it ask whether an automated-driving feature is allowed when map freshness is 42 days and speed-limit confidence is only 62 percent?
Those are not rendering questions. They are reasoning questions.
From Geometry To Map Science
The interesting part of map intelligence starts when geometry becomes topology.
A raw polyline says where a lane centerline runs. A topological lane graph says how that lane connects to the road network. It encodes predecessors, successors, left neighbors, right neighbors, intersection membership, lane type, lane boundary geometry, and lane marking type. Once those relationships exist, a route is no longer just a line on a screen. It is a chain of connected lane segments with legal, physical, and behavioral implications.
That is where map science becomes useful for AI.
A vehicle needs coordinate frames, not just coordinates. It needs to transform global map data into a local ego-centric frame. It needs to project actor positions onto lane centerlines. It needs to calculate distance along a path, not only Euclidean distance. It needs heading alignment, curvature, lane membership, turn feasibility, conflict zones, occlusion regions, stop-line distance, and receiving-lane storage.
In a rendered map, these details are easy to hide. In a reasoning system, they matter.
A pedestrian 4 m from a crosswalk is different from a pedestrian 4 m behind a wall. A vehicle 31.1 m from a conflict zone is different if its closing speed is 40.0 kph and the yield threshold is 4.0 s. A green light is different if the downstream lane has 3.2 m of storage and the ego vehicle is 4.8 m long.
The map has to stop being a passive background layer.
It has to become a structured context engine.
The Public Data Basis
The strongest public-data foundation for this POC is Argoverse 2 Motion Forecasting.
Argoverse 2 gives a clean starting point because the Motion Forecasting dataset contains 250,000 scenarios collected from six cities. Each scenario is 11 seconds long and includes tracked actors, timestamps, focal actor information, positions, headings, velocities, object types, and categories.
The Argoverse 2 HD map API is just as important as the motion data. Each scenario carries a local HD map with lane, crosswalk, and drivable-area geometry. The lane graph contains predecessor lanes, successor lanes, left and right neighbors, boundary geometry, marking types, lane type, and intersection flags.
That means the public dataset already contains the raw material for location knowledge.
The POC uses the AV2 model as the public-data reference point. The browser page uses compact normalized scenario packages instead of re-hosting the dataset. That is intentional because AV2 is available through the Registry of Open Data on AWS, where the dataset license is listed as CC-BY-NC-SA-4.0. The official av2-api repository is MIT licensed and provides the right foundation for a reproducible local data workflow later.
For this stage, I wanted the web experience to show the reasoning pattern without forcing the page to load a full public dataset.
The data model I care about is compact: scenario identity, city context, actor tracks, timestamps, focal actor, lane segments, lane boundaries, crosswalk polygons, drivable areas, lane topology, and derived relationships at a selected moment.
That is enough to move from a map viewer into a Knowledge Graph.
What I Built
The implemented page is an interactive POC and public-data-backed concept demonstrator for Map Knowledge Graph reasoning in autonomous-driving context.
The current route opens directly into the Blind-Corner Crosswalk Risk interactive POC.
It starts from normalized scene data and builds a graph of map entities, dynamic actors, observations, constraints, rules, and decision evidence. The point is not to run a full autonomy stack in the browser. The point is to make location reasoning inspectable.
The current implementation includes one default decision-layer scenario and four focused decision stories: Map Knowledge Graph Decision Layer, Blind-Corner Crosswalk Risk, Green Light, No Exit, Left-Turn Conflict Window, and ODD Readiness Gate.
The pipeline is simple enough to inspect. A public autonomous-driving data model is normalized into scenario packages. Map and actor entities become graph nodes. Topology, proximity, intersection, control, constraint, and causality become graph edges. A deterministic evaluator walks those edges and produces an explanation trace. The page renders the scene, the graph, and the evidence behind the current decision state.
That last word matters: evidence.
I did not want the POC to say, "the vehicle waits," without showing why. I wanted it to expose the chain: this signal controls this lane, this rule applies to this maneuver, this path intersects this crosswalk, this actor is near this conflict zone, this downstream storage is shorter than the vehicle, this map-quality condition gates this feature.
That chain is the product.
The Knowledge Graph Layer
The graph model is intentionally small, but it uses the same concepts that matter in larger systems.
The main node types are Scenario, LaneSegment, Crosswalk, DrivableArea, Actor, Observation, TrafficControl, RoutePath, Constraint, Decision, and MapQualityCondition.
The main relationship types are HAS_LANE, HAS_CROSSWALK, HAS_ACTOR, OBSERVED_AT, NEXT, LEFT_NEIGHBOR, RIGHT_NEIGHBOR, NEAR_LANE, NEAR_CROSSWALK, AHEAD_OF, INTERSECTS_LIKELY_PATH, CONTROLS, APPLIES_TO, CONSTRAINS, GATES, and CAUSES_DECISION.
Some edges are direct map topology. NEXT connects a lane segment to its successor. LEFT_NEIGHBOR and RIGHT_NEIGHBOR preserve lateral topology. Other edges are derived from geometry and time. NEAR_LANE comes from actor position against lane geometry. AHEAD_OF comes from relative position along a lane or route path. INTERSECTS_LIKELY_PATH connects a maneuver to a crosswalk or conflict zone. CAUSES_DECISION turns a graph relationship into an evidence path.
This is where Knowledge Graphs become more than a storage format.
A graph can carry semantics, not only coordinates. It can distinguish a static map fact from a dynamic observation. It can preserve source layers such as static_map, perception, dynamic_scene, rule, map_quality, and decision. It can expose provenance for each edge. It can represent temporal assertions, such as an actor observed at timestep 52 or a closure active at timestamp 45. It can separate raw facts from inferred constraints.
That separation is what makes the explanation credible.
An AI model can use the graph as retrieval context. A deterministic rule can use it as a guard. A test can assert that a specific evidence edge exists. A human can inspect why a scenario is constrained without reading every coordinate in the fixture.
The graph gives the scene a grammar.
Why Ontologies Still Matter
The research foundation is not new, and that is part of why I find it interesting.
Suryawanshi, Qiu, Ayara, and Glimm describe an ontology-based knowledge layer between map data and driver-assistance functions in An Ontological Model for Map Data in Automotive Systems. The important architectural idea is a split between protocol-dependent map data and a protocol-independent core ontology. Driver-assistance functions query the knowledge layer instead of depending only on fixed low-level API calls.
That maps directly to this POC. The browser does not care whether a lane came from a public dataset, an HD map supplier, an OpenStreetMap-derived source, or a transformed internal format. It cares that the lane has identity, geometry, topology, relationships, constraints, and provenance.
Buechel et al. are useful for the traffic-rule side of the story. Their ontology-based framework links semantic scene representation, traffic regulations, situation classification, and decision-making rules. Bagschik et al. are useful for scenario creation because they treat road layout, infrastructure, temporary changes, objects, and environment as connected layers.
That layered view matters for maps.
A road scene is not one layer. It is geometry, topology, traffic infrastructure, temporary changes, actor motion, environmental context, map quality, and rules. A map product may deliver these as files and attributes. A vehicle needs them as connected meaning.
The Scenario Stories
The default scenario is a right-turn decision layer.
The vehicle approaches a right turn. The graph connects the current lane, red signal state, no-right-on-red rule, stop line, crosswalk, target lane, lower speed limit, and an active target-lane closure. The final decision state is stop, do not turn right, and request replanning or waiting.
Aerial right-turn decision layer with signal, stop line, crosswalk, closure, and map knowledge graph evidenceClick to inspect full size
That decision is not explained by one object. It is explained by a bundle of map and rule relationships. The signal controls the lane. The rule applies to the maneuver. The stop line precedes the crosswalk and intersection zone. The target lane is closed. The route is invalid for now.
The blind-corner crosswalk case is more subtle.
The signal is green and no pedestrian is visible in the turn path. A geometry-only view might make the road look open. The graph knows the right-turn path intersects a mapped crosswalk, the crosswalk belongs to a pedestrian-priority zone, and a delivery vehicle occludes a crosswalk entry point. The decision becomes creep, verify the occluded crosswalk, and prepare to stop. The current speed cap is 5 kph because the visible scene is incomplete.
Aerial blind-corner right-turn scene with crosswalk occlusion and map knowledge graph evidenceClick to inspect full size
That is one of the reasons I like this example. It shows that absence of detection is not the same as absence of risk.
The green-light blocked-intersection case is topology over signal state.
The light is green, but the downstream exit has only 3.2 m of receiving space while the ego vehicle length is 4.8 m. The graph links the route path to a keep-clear zone, a downstream queue, and an available-storage measurement. The decision is to hold before the intersection despite the green signal.
Aerial green-light blocked-intersection scene with downstream queue and knowledge graph storage evidenceClick to inspect full size
The unprotected-left-turn case separates legal permission from executable action.
The map allows the left turn, but the path crosses an opposing-traffic conflict zone and a crosswalk conflict zone. The opposing vehicle is 31.1 m from the conflict zone with a 40.0 kph closing speed, which gives a 2.8 s time-to-conflict against a 4.0 s yield threshold. The decision is to wait and yield until both conflict zones are clear.
Aerial unprotected-left-turn conflict scene with opposing traffic, crosswalk conflict, and knowledge graph evidenceClick to inspect full size
The ODD readiness case is not about a maneuver. It is about whether the feature should be available.
The road looks usable, but the graph checks operating-design-domain conditions: lane connectivity, divider presence, traffic-control completeness, supported road class, speed-limit confidence, and map freshness. In the scenario, lane connectivity is incomplete, speed-limit confidence is 62 percent against a 90 percent threshold, and map freshness is 42 days against a 30 day threshold. The decision is do not activate the AD feature and downgrade automation.
Aerial ODD readiness gate scene with lane graph continuity, roadworks, map quality, and feature-gating evidenceClick to inspect full size
That example is important because it shows location knowledge as a feature gate, not only a scene explanation.
Why This Becomes AI Infrastructure
Vehicle AI already uses perception, localization, maps, prediction, planning, and vehicle state. The weak point is often not one missing model. It is the interface between facts.
A camera model can detect a pedestrian. A tracker can estimate velocity. A map can contain a crosswalk. A planner can evaluate candidate trajectories. None of those facts is enough alone.
The useful context is the connection: the pedestrian is near the crosswalk, the crosswalk intersects the likely path, the lane is inside an intersection, the selected actor is approaching the junction, and the relationship changed between two timesteps.
That connection is location knowledge.
For AI systems, a graph like this can become retrieval context, rule context, validation context, and explanation context. It can feed a language model with grounded evidence instead of dumping raw coordinates. It can support embeddings over semantic neighborhoods. It can help mine scenarios where a certain pattern appears, such as a crosswalk near an occluded turn path or an ODD gate failing because map freshness exceeds a threshold.
It also gives engineers a better debugging surface.
Instead of asking why a black-box output changed, you can inspect which edge changed. Was the actor no longer near the crosswalk? Did the route path stop intersecting the conflict zone? Did the speed-limit confidence cross the threshold? Did the lane graph lose a successor edge? Did the map tile become stale?
That is the kind of interface I want vehicle AI systems to have.
What This POC Does Not Claim
This POC is not an autonomous-driving stack.
It does not perform perception. It does not train a forecasting model. It does not output safety-certified driving decisions. It does not prove production latency. It does not claim HD-map freshness. It does not use private or proprietary map data.
It demonstrates a narrower point: location knowledge can be represented as a graph of entities, relationships, constraints, evidence, and temporal observations.
That is enough for this stage.
The Open Source Plan
I plan to make the code available on GitHub later.
The repository will focus on a practical pipeline: load a public scenario source, normalize map and actor data, build a small graph, compute deterministic relationships, expose queryable evidence paths, and render the scene, graph, and explanation.
The dataset will not be re-hosted in the repo. The README should point users to the official public dataset source and explain how to prepare the required data locally.
The next version may add candidate-scenario selection, more AV2-backed examples, fixed natural-language questions mapped to deterministic queries, and richer provenance for each graph edge.
For now, the goal is clear.
Turn map geometry and actor tracks into inspectable location knowledge.
That is the part of Knowledge Defined Vehicles I wanted to make visible.
Hussam Ahmed
Building large-scale systems by day, exploring the universe by night.
Keep reading
Claude Code Dynamic Workflows: A Practical Guide to the New Orchestration Feature
A practical guide to Claude Code dynamic workflows: what the new feature does, when to use it, how to trigger it, and how to design workflows that split, verify, loop, and synthesize real engineering work.
Read articleProjectGenesis: A Repo-Native Control Layer for AI-Built Software
ProjectGenesis is a Markdown-first scaffold for turning rough AI-built product ideas into traceable requirements, specs, backlog items, reviews, tests, and handoffs.
Read articleFeatured project
See the Map Knowledge Graph reason about a live driving scene.
An interactive simulator with scenario switching, graph traversal, and step-by-step decision playback.
Follow new posts
I share build logs on AI systems, execution, and astrophotography as they ship — no schedule, only substance.